
Here’s the thing about collaboration diagrams: they’re built for a specific situation. You need to show how software components communicate, but the connections between objects matter more than when each message fires.
Think of it as mapping the wiring diagram of your interactions. Sequence diagrams tell you the story chronologically. Collaboration diagrams show you the network that makes those conversations possible.
What Is a Collaboration Diagram
A collaboration diagram maps specific object instances working together to complete one job—processing a payment, authenticating a user, that sort of thing.
What you’re looking at:
Objects: Rectangles with labels following the pattern instanceName:ClassName. You might see myCart:ShoppingCart or just :ShoppingCart when the particular instance doesn’t matter. That underline matters—it signals you’re dealing with an actual object instance, not just a class.
Links: The lines connecting objects. These aren’t arbitrary. Each link must represent a real relationship from your class diagram. Two objects with no link between them? They can’t send messages to each other. That’s a hard rule.
Messages: Arrows along those links, numbered to track execution order. Message 1 happens first, then 2. When things get nested, you’ll use decimals—message 1.1 executes during message 1, and 1.1.1 nests one level deeper.
The original UML 1.x specification called these “collaboration diagrams.” UML 2.0 changed the name to “communication diagrams”—supposedly clearer, though developers still use both names freely. The diagrams themselves? Completely unchanged.
Communication diagrams emphasize the structural organization of objects that send and receive messages, making them particularly valuable when the architecture of collaborating objects matters more than the time ordering of interactions.
Grady Booch, one of UML’s creators
The core difference works like this: sequence diagrams line up objects horizontally and let time flow down the page. Collaboration diagrams let you arrange objects any way you want. Group them by architectural layer. Spread them to match physical deployment. Organize them to reveal your system’s actual topology. When spatial relationships carry meaning, that freedom becomes powerful.
How Collaboration Diagrams Work in UML
The mechanics combine structural and behavioral modeling in one view. Let’s walk through how UML collaboration diagrams actually function.
Object naming sticks to a formula. Instance name, colon, class name: userCart:ShoppingCart. If the specific instance doesn’t matter, drop the name but keep the colon: :ShoppingCart. That underline distinguishes objects from classes. Miss it and you’re technically showing something else entirely.
Message numbering creates a hierarchy smarter than it first looks. Your first message gets 1. Second gets 2. Straightforward so far. But when message 1 triggers two more calls, those become 1.1 and 1.2. If 1.1 triggers another call? That’s 1.1.1.
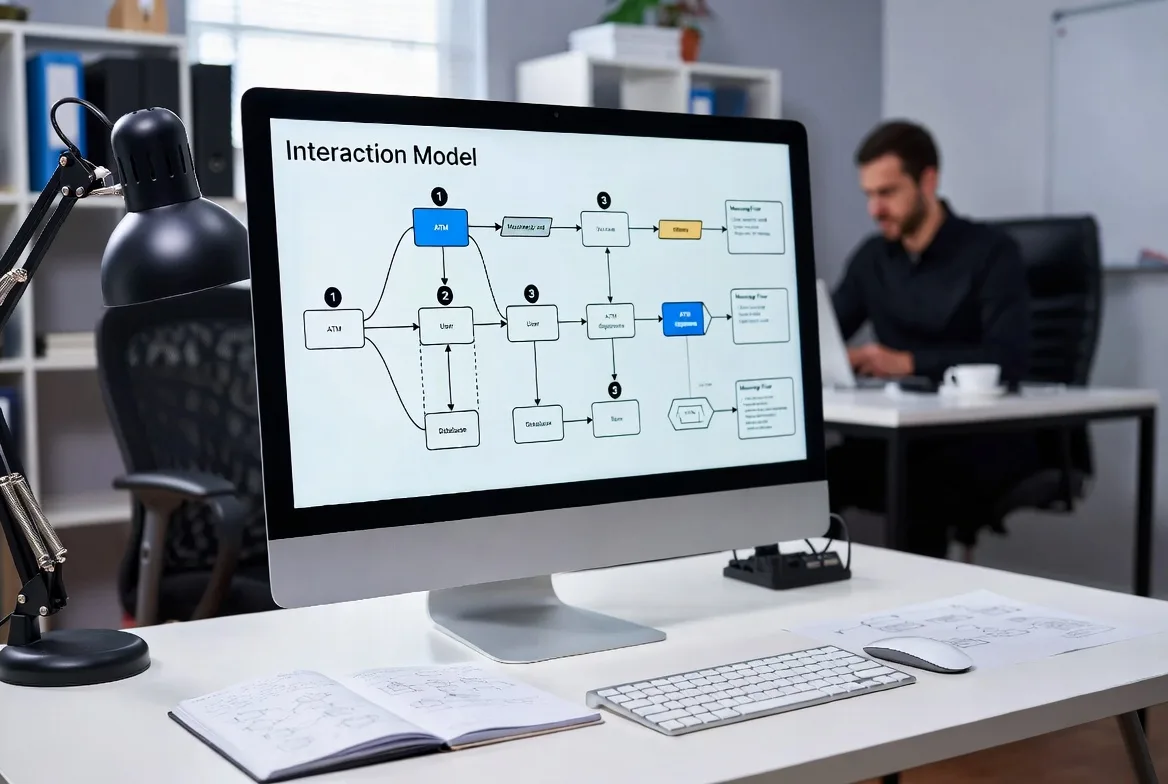
Real example time—an ATM withdrawal. Message 1 means “user requests cash.” That triggers 1.1 “verify account,” which splits into 1.1.1 “check balance” and 1.1.2 “check daily limit.” Meanwhile, message 2 “dispense cash” waits until everything under message 1 completes. Then 2.1 “update balance” follows.
This numbering captures call hierarchy without requiring vertical space. Elegant, really.
Links must be real. You can’t just draw lines wherever they look nice. Each link represents an actual relationship from your class model—association, attribute, parameter, something concrete. See a message without its supporting link? That’s broken.
Reading the flow means forgetting your usual left-to-right habits. Find message 1. Track numbers in order. When you hit decimals, remember that 1.1 doesn’t happen after 1—it happens during 1. Takes some practice.
Want conditional messages? Wrap conditions in brackets: [balance > amount] 1: withdraw(). For repetition, add an asterisk: *1: processItem() fires multiple times.
Collaboration Diagram vs Sequence Diagram
Both model identical interactions. They just highlight different angles. Pick based on what story you’re telling.
| Aspect | Collaboration Diagram | Sequence Diagram |
|---|---|---|
| Visual Focus | Network topology and object relationships | Message timing and chronological flow |
| Message Ordering | Decimal numbering (1, 1.1, 2, 2.1) | Vertical position (earlier = higher) |
| Space Efficiency | Complex networks fit compact layouts | Grows vertically as interactions lengthen |
| Complexity Handling | Shines with many interconnected objects | Handles long procedural sequences better |
| Best Use Cases | Design patterns, architectural reviews | Detailed workflows, timing constraints |
| Learning Curve | Decimal numbering takes getting used to | Top-to-bottom flow reads naturally |
Use collaboration format when: You’re documenting a design pattern where object positioning matters. You need to show connections between architectural layers. Your interaction involves dozens of objects with intricate relationships. You’re fitting everything on one printed page. You’re validating that objects only talk through approved channels.
Reach for sequence diagrams when: Chronological order drives the interaction. You’re modeling a 30-step workflow. Your audience doesn’t know UML conventions (sequence reads more intuitively). You need timing constraints, optional paths, or control flow with loops.
Converting between them: They’re semantically identical. Every collaboration diagram translates to a sequence diagram and back. Numbered messages map to vertical positions. Links become lifelines. Many tools convert with one click. You might lose some layout finesse (collaboration diagrams allow free positioning while sequence diagrams impose structure), but the meaning carries over perfectly.

Types of UML Interaction Diagrams
Collaboration diagrams belong to a family. Each member shows dynamic behavior from a different angle.
The full lineup:
Sequence diagrams dominate actual practice. Objects line up across the top. Time flows downward. Each object gets a lifeline, with messages as horizontal arrows. You can show when objects are actively processing, add loops and conditionals, mark timing. These get taught first in most courses.
Communication diagrams—that’s what UML 2.x calls collaboration diagrams now—prioritize structure over sequence. Free-form layouts mean you position objects to match system architecture. Put database objects at the bottom, UI at the top, business logic between them. Numbers handle sequencing without eating vertical space.
Timing diagrams obsess over state transitions across time. Horizontal axis shows timeline. Vertical shows objects or states. Essential for real-time systems, embedded controllers, anywhere timing drives design. Picture a traffic light controller transitioning through states during a 90-second cycle, or sensors coordinating during manufacturing.
Interaction overview diagrams give you the bird’s-eye view. They’re activity diagrams where each activity can be a sequence or communication diagram. Show how different scenarios connect—successful login leads here, failed login goes there. Great for complex use cases with multiple paths.
Where collaboration diagrams land: They hit a middle ground. More structural context than sequence diagrams but less timing precision than timing diagrams. More message detail than overviews but less flow control. Perfect when you need both message content and architectural organization visible.
Collaboration Diagram Examples and Use Cases
Concrete examples beat abstract explanations every time.
ATM withdrawal:
Your diagram includes:
– :ATM (machine interface)
– :Account (customer’s account)
– :Bank (banking backend)
– :CashDispenser (physical hardware)
Messages flow:
1. insertCard() from customer to :ATM
1.1. validateCard() from :ATM to :Bank
1.2. requestPIN() from :ATM back to customer
2. enterPIN() from customer to :ATM
2.1. verifyPIN(pin) from :ATM to :Bank
3. requestAmount() from :ATM to customer
4. enterAmount(amount) from customer to :ATM
4.1. checkBalance(amount) from :ATM to :Account
4.2. [balance >= amount] debit(amount) from :ATM to :Account
4.3. dispenseCash(amount) from :ATM to :CashDispenser
The layout reveals architecture: ATM coordinates everything, bridging user interface, banking backend, account data, and physical hardware. Numbers preserve sequence without vertical sprawl.
E-commerce checkout:
Components:
– :ShoppingCart
– :PaymentProcessor
– :InventorySystem
– :OrderManager
– :EmailService
Spatial arrangement mirrors system layers. Maybe :ShoppingCart and :OrderManager sit centrally. :PaymentProcessor and :EmailService position as external services on the edges. :InventorySystem represents backend database layer at the bottom.
Checkout triggers message flow while making architectural boundaries visible.
Login authentication:
Security example with:
– :LoginForm
– :AuthenticationService
– :UserDatabase
– :SessionManager
– :AuditLog
The diagram shows :SessionManager and :AuditLog both receiving messages from :AuthenticationService, revealing dual responsibilities (create sessions, log attempts). Crucially, structure makes clear that :LoginForm never touches :UserDatabase directly—everything flows through :AuthenticationService.
Best use scenarios:
Design pattern documentation benefits enormously. Observer pattern becomes obvious with Subject centered and Observer objects arranged around it, bidirectional links showing attachment and notification.
Architecture reviews gain precision. Need to verify objects communicate only through approved channels? Explicit links make violations obvious immediately.
Limited screen space or printed documentation? Collaboration diagrams pack complex interactions into compact layouts without the vertical sprawl sequence diagrams require.

Creating Your First Collaboration Diagram
Building effective diagrams follows a systematic approach balancing accuracy with clarity.
The process:
- Pick your scenario: Choose one specific use case or function. Don’t try showing everything—narrow scope to one coherent interaction.
- List participants: Which object instances participate? Include only objects actively sending or receiving messages.
- Draw structural links: Connect objects that communicate. These must match actual relationships from your class diagram—associations, aggregations, dependencies.
- Find your trigger: What starts this interaction? That’s message 1.
- Add more messages: Track the logic, numbering in order. Nested calls during another message’s execution get decimal notation.
- Optimize layout: Position objects to minimize crossed lines and reflect architectural grouping. No single “correct” arrangement exists.
- Include conditions and iterations: Guard conditions go in brackets for conditional messages. Asterisks mark repetition.
- Review ruthlessly: Verify every link matches your class model, message numbers follow logical sequence, the diagram tells a coherent story.
Common mistakes:
Messages without links violate the rules. Every message needs structural connection. Objects must communicate but lack direct links? Add an intermediary or update your class model.
Inconsistent numbering confuses readers. If 1.1 and 1.2 both trigger from message 1, they’re peers. Don’t skip from 1.1 to 1.3 without 1.2.
Cramming destroys clarity. More than ten objects? Split into multiple diagrams or use an interaction overview showing how smaller collaborations connect.
Ignoring audience familiarity wastes effort. Stakeholders unfamiliar with UML? Add annotations or switch formats.
Tool choices:
Professional-grade tools like Enterprise Architect, Visual Paradigm, and MagicDraw offer full support with syntax checking and model consistency validation. They keep diagrams synchronized with class models.
Mid-weight options like draw.io (now diagrams.net) and Lucidchart provide decent support without full model integration.
Text-based tools like PlantUML let you define diagrams in text (great for version control), though positioning control suffers.
Early design? Whiteboard works fine. Thinking matters more than tooling.
Clarity guidelines:
Stick with consistent naming conventions. CamelCase in class diagrams means camelCase in collaboration diagrams.
Group related objects visually. Cluster objects from the same architectural layer. Color-code if possible.
Message labels need the right level: verifyCredentials(username, password) works better than just verify(), but don’t go overboard with verifyUserCredentialsAgainstDatabaseRecordsUsingSecureEncryption().
Document non-obvious choices. If a particular message sequence prevents race conditions or implements security requirements, add a note explaining why.
Version diagrams with code. Collaboration diagrams document design decisions. When decisions change, update diagrams. Outdated diagrams mislead worse than missing ones.
FAQs
Yes, though the official name changed to “communication diagrams.” UML 2.x renamed them (apparently the old name confused people), but functionality stayed identical. Tools and developers still use both terms freely. The diagrams remain fully supported in current UML standards and continue serving their original purpose: showing object interactions with structural emphasis.
Absolutely—they’re semantically equivalent, meaning either format can represent what the other shows. Sequence diagram messages map directly to numbered collaboration messages. Lifelines become objects with links. Most UML tools offer automatic conversion between formats. Fair warning though: layout optimization might suffer, and extremely complex sequence diagrams with many combined fragments can get messy in collaboration format.
Pick collaboration when structural relationships matter as much as message order. When you need to fit complex interactions in limited space. When documenting design patterns where object positioning carries meaning. When showing how architectural layers interact. Go with sequence when precise timing and chronological order dominate. When showing long procedural sequences. When your audience lacks UML familiarity. When you need detailed control flow with loops and conditionals.
Collaboration diagrams offer a unique perspective on object interactions by highlighting structural relationships alongside behavioral sequences. Sequence diagrams get used more often thanks to their intuitive chronological layout, but collaboration diagrams shine when architectural context matters—when understanding the organization and connections between objects matters as much as message flow.
The UML 2.0 shift from “collaboration” to “communication” terminology hasn’t reduced their utility. These diagrams still serve architects and developers documenting design patterns, verifying architectural constraints, or explaining complex interactions compactly. The numbered messaging approach requires more initial learning than sequence diagrams’ vertical flow, but that investment pays off when modeling systems where object topology carries significance.
Using collaboration diagrams effectively means recognizing them as one option among several in the interaction diagram family. Experienced modelers choose diagram types based on communication needs, not habit. Sometimes sequence diagrams’ temporal clarity serves audiences better. Other times, collaboration diagrams’ structural emphasis provides exactly the insight needed to understand design decisions or spot architectural issues.
Start simple—model familiar interactions like user login or data retrieval. Get basics right: accurate links, logical message numbering, clear object identification. With experience, you’ll develop intuition for when collaboration diagrams add value and how to arrange objects for maximum clarity. The goal isn’t perfect UML—it’s building shared understanding of how system components work together.